-
Type:
Enhancement
-
Resolution: Not an Issue
-
Priority:
 P3
P3
-
Affects Version/s: hs23.5, hs25
-
Component/s: hotspot
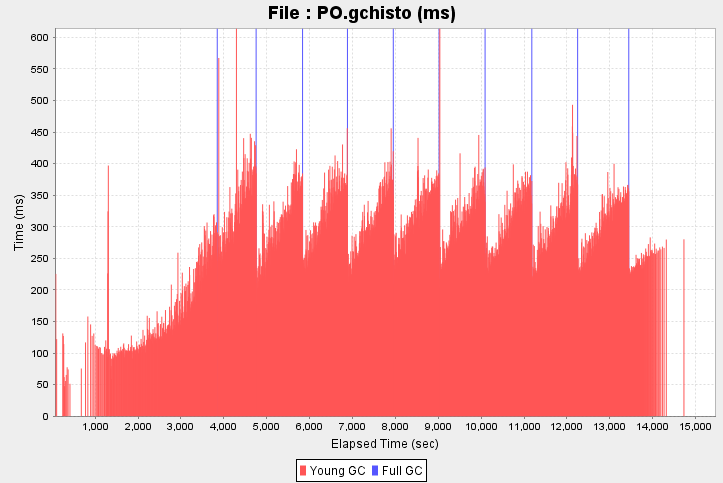
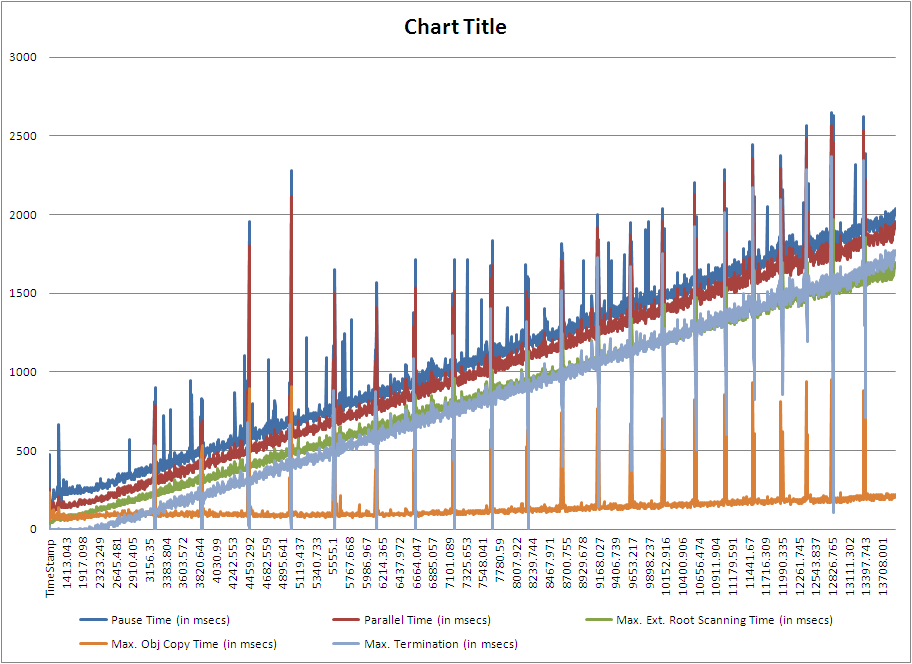
PSR ran with ParOld and G1 and saw ARTs of ~1.15secs and 10.85secs respectively. After plotting the max and average times for the sub-tasks for all pauses for G1GC, I noticed that termination times were following the steady increase in pause time trend and high (single) external root scan time was the reason why.
A plausible cause could be code cache scanning by a single thread during each pause. For ParOld, I think its alleviated due to the frequent full GCs that cause class unloading.
After discussing this with John C2, there are a couple of things that can be done:
1) Add claiming mechanism such that the code cache is not treated as a single root.
2) There is already a CR for G1 that could help this case for G1: http://bugs.sun.com/view_bug.do?bug_id=7145569
- relates to
-
-
- Resolved
-
-
-
- Resolved
-
-
-

- Resolved
-
-
-
- Closed
-