-
Type:
Enhancement
-
Resolution: Unresolved
-
Priority:
 P4
P4
-
Affects Version/s: fx2.0
-
Component/s: javafx
This dates from JavaFX 1.x but 1.x allowed much more easier configuration of the series and data rendering of an XYChart without resorting to too much head scratching and CSS wizardry... so in the older version it was easier to achieve the some of the desired result with existing chart classes.
Currently we have LineChart, AreaChart, ScatterChart and BubbleChart which are basically the exact same kind of chart but with different rendering options for series and data. I do not include BarChart in this list as it is a very different and unrelated type of XYChart when it comes to display and rendering.
It's not uncommon in economics or scientific data display to have an XYChart where a series is rendering as an area while another is rendered as a line and the third as a cloud of dots or as some kind of bubble (though usually not the kind of bubble currently rendered in JavaFX 2.0).
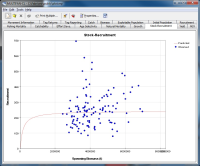
See attached ChartStockRecruitment-old.jpg which comes from an older Java program using a custom chart API: it shows up the stock-recruitment relationship of the recruitment of some tuna species over the spawning biomass. This is a display that is actually used in a stock assessment analysis, it's a mix of a line and a could of dots.
So we need a way to be able to mix data series with different rendering options.
Instead of having gazillions of specialized classes that basically do the same with only a single type of series/data rendering per subclass, it would make much more sense to have 1 class (LineChart or ValueChart for example) and to be able to specify rendering options for each Series and Data separatly.
Ie:
For series, we have the following rendering options: Series.Presentation.LINE, Series.Presentation.AREA, Series.Presentation.NONE or Series.Presentation.CUSTOM
For data, we have the following rendering options: Data.Presentation.NONE, Data.Presentation.NODE, Data.Presentation.BUBBLE or Data.Presentation.CUSTOM
In site a chart:
- When a series is represented as an area: -> Series.Presentation.AREA and Data.Presentation.NONE (JavaFX 1.3) or Data.Presentation.NODE (JavaFX 2.0)
- When a series is represented as a line: -> Series.Presentation.LINE and Data.Presentation.NONE (undecorated line) or Data.Presentation.Data.Presentation.NODE (decorated line)
- When a series is represented as a scatter plot: -> Series.Presentation.NONE and Data.Presentation.Data.Presentation.NODE
- When a series is represented as a bubble plot: -> Series.Presentation.NONE and Data.Presentation.Data.Presentation.BUBBLE
If implemented, both CUSTOM value would allow users to provide their own rendering for the series or the data itself (part of the rendering mechanism of the series needs to be exposed to allow that) such as using images or different kinds of nodes, etc.
Using the same idea if the JavaFX team decide to implement Star/RadialChart (something desirable) they do not have to implement RadialAreaChart, RadialLineChart, RadialScatterChart, ... they only need to implement RadialChart and using the decoration attributes the user can mix several kinds of series in the exact same radial chart.
The only alternative I currently see to this would be to allow creating undecorated plot area so charts could be superimposed on top of each other (I've already made a couple of RFEs leading to that direction).

