-
Type:
Bug
-
Resolution: Duplicate
-
Priority:
 P4
P4
-
Affects Version/s: fx2.1
-
Component/s: javafx
-
Environment:
Windows 7 64bit, JDK 1.7.0_04 beta 64bit, JavaFX 2.1 beta 19 64bit
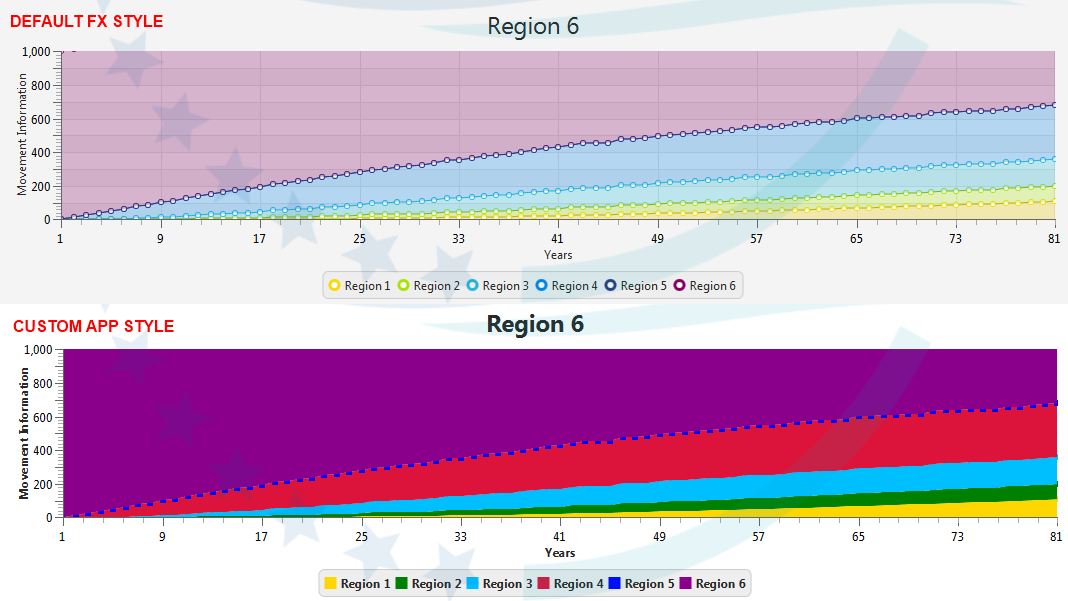
When using a custom CSS for AreaChart/StackedAreaChart, series with small values are not correctly rendered in StackedAreaChart.
See attached image, there is a distinct set of blue boxes acros the chart where the 5th series lies.
Values for this series are in the 5th column of the attached values set.
These values are between 0 and 0.9, as such they should not be visible in a chart where the Y axis ranges from 0 to 1,000.
Values used to create this chart:
# Region 6
0.0 0.0 0.0 0.0 0.0 1000.0
0.0 0.0 0.0 14.2 0.0 985.8
0.0 0.1 0.6 27.5 0.0 971.7
0.0 0.4 1.7 39.9 0.0 957.9
0.0 0.8 3.3 51.5 0.0 944.3
0.1 1.3 5.3 62.5 0.0 930.9
0.1 1.9 7.5 72.8 0.0 917.6
0.2 2.6 10.0 82.6 0.0 904.6
0.3 3.4 12.8 91.9 0.0 891.7
0.4 4.2 15.6 100.7 0.0 879.0
0.6 5.1 18.7 109.1 0.0 866.5
0.8 6.1 21.8 117.1 0.0 854.2
1.0 7.2 25.1 124.7 0.0 842.0
1.2 8.2 28.4 132.1 0.0 830.1
1.5 9.4 31.7 139.2 0.0 818.2
1.8 10.5 35.1 145.9 0.1 806.6
2.1 11.8 38.5 152.5 0.1 795.1
2.5 13.0 41.8 158.8 0.1 783.8
2.9 14.3 45.2 164.8 0.1 772.7
3.4 15.6 48.6 170.7 0.1 761.7
3.9 16.9 51.9 176.4 0.1 750.8
4.4 18.3 55.2 181.8 0.1 740.2
5.0 19.7 58.5 187.1 0.1 729.6
5.6 21.1 61.7 192.3 0.1 719.2
6.2 22.5 64.9 197.3 0.2 709.0
6.9 23.9 68.0 202.1 0.2 698.9
7.7 25.3 71.1 206.8 0.2 689.0
8.4 26.8 74.1 211.3 0.2 679.2
9.3 28.2 77.1 215.7 0.2 669.5
10.1 29.7 80.0 220.0 0.2 660.0
11.0 31.1 82.9 224.1 0.2 650.6
12.0 32.6 85.7 228.1 0.3 641.4
13.0 34.1 88.4 232.1 0.3 632.2
14.0 35.5 91.1 235.8 0.3 623.2
15.1 37.0 93.7 239.5 0.3 614.4
16.2 38.5 96.3 243.1 0.3 605.6
17.3 39.9 98.8 246.6 0.3 597.0
18.5 41.4 101.3 249.9 0.4 588.5
19.8 42.9 103.6 253.2 0.4 580.2
22.4 45.7 108.3 259.4 0.4 563.8
23.8 47.2 110.5 262.4 0.4 555.8
25.2 48.6 112.7 265.3 0.4 547.9
26.6 50.0 114.8 268.1 0.4 540.1
28.1 51.4 116.8 270.8 0.5 532.4
29.7 52.8 118.8 273.4 0.5 524.8
31.2 54.2 120.8 275.9 0.5 517.3
32.8 55.6 122.7 278.4 0.5 510.0
34.5 56.9 124.6 280.7 0.5 502.7
36.2 58.3 126.4 283.0 0.5 495.6
37.9 59.6 128.1 285.2 0.6 488.5
39.7 61.0 129.8 287.4 0.6 481.6
41.5 62.3 131.5 289.4 0.6 474.7
43.4 63.6 133.1 291.4 0.6 468.0
45.2 64.8 134.6 293.4 0.6 461.3
47.2 66.1 136.1 295.2 0.6 454.8
49.1 67.3 137.6 297.0 0.6 448.3
51.1 68.6 139.0 298.7 0.6 441.9
53.1 69.8 140.4 300.4 0.7 435.6
55.2 71.0 141.8 301.9 0.7 429.5
57.3 72.2 143.1 303.5 0.7 423.3
59.4 73.3 144.3 304.9 0.7 417.3
61.6 74.5 145.5 306.3 0.7 411.4
63.8 75.6 146.7 307.6 0.7 405.5
66.0 76.7 147.8 308.9 0.7 399.8
68.3 77.8 148.9 310.1 0.7 394.1
70.6 78.9 150.0 311.3 0.8 388.5
72.9 80.0 151.0 312.4 0.8 383.0
75.2 81.0 152.0 313.5 0.8 377.5
77.6 82.0 153.0 314.5 0.8 372.2
80.0 83.0 153.9 315.4 0.8 366.9
82.5 84.0 154.8 316.3 0.8 361.6
84.9 85.0 155.6 317.1 0.8 356.5
87.4 86.0 156.4 317.9 0.8 351.4
89.9 86.9 157.2 318.7 0.8 346.4
92.5 87.8 157.9 319.4 0.8 341.5
95.1 88.7 158.7 320.0 0.9 336.7
97.7 89.6 159.3 320.6 0.9 331.9
100.3 90.5 160.0 321.2 0.9 327.2
102.9 91.3 160.6 321.7 0.9 322.5
105.6 92.1 161.2 322.2 0.9 317.9
108.3 92.9 161.8 322.6 0.9 313.4
Custom CSS used for decorating the series:
.mfcl-chart .default-color0.chart-series-area-line { -fx-stroke: transparent; }
.mfcl-chart .default-color1.chart-series-area-line { -fx-stroke: transparent; }
.mfcl-chart .default-color2.chart-series-area-line { -fx-stroke: transparent; }
.mfcl-chart .default-color3.chart-series-area-line { -fx-stroke: transparent; }
.mfcl-chart .default-color4.chart-series-area-line { -fx-stroke: transparent; }
.mfcl-chart .default-color5.chart-series-area-line { -fx-stroke: transparent; }
.mfcl-chart .default-color6.chart-series-area-line { -fx-stroke: transparent; }
.mfcl-chart .default-color7.chart-series-area-line { -fx-stroke: transparent; }
.mfcl-chart .default-color8.chart-series-area-line { -fx-stroke: transparent; }
.mfcl-chart .default-color0.chart-series-area-fill { -fx-fill: gold; }
.mfcl-chart .default-color1.chart-series-area-fill { -fx-fill: green; }
.mfcl-chart .default-color2.chart-series-area-fill { -fx-fill: deepskyblue; }
.mfcl-chart .default-color3.chart-series-area-fill { -fx-fill: crimson; }
.mfcl-chart .default-color4.chart-series-area-fill { -fx-fill: blue; }
.mfcl-chart .default-color5.chart-series-area-fill { -fx-fill: darkmagenta; }
.mfcl-chart .default-color6.chart-series-area-fill { -fx-fill: black; }
.mfcl-chart .default-color7.chart-series-area-fill { -fx-fill: pink; }
.mfcl-chart .default-color8.chart-series-area-fill { -fx-fill: orange; }
.mfcl-chart .default-color0.chart-area-symbol { -fx-background-color: gold; }
.mfcl-chart .default-color1.chart-area-symbol { -fx-background-color: green; }
.mfcl-chart .default-color2.chart-area-symbol { -fx-background-color: deepskyblue; }
.mfcl-chart .default-color3.chart-area-symbol { -fx-background-color: crimson; }
.mfcl-chart .default-color4.chart-area-symbol { -fx-background-color: blue; }
.mfcl-chart .default-color5.chart-area-symbol { -fx-background-color: darkmagenta; }
.mfcl-chart .default-color6.chart-area-symbol { -fx-background-color: black; }
.mfcl-chart .default-color7.chart-area-symbol { -fx-background-color: pink; }
.mfcl-chart .default-color8.chart-area-symbol { -fx-background-color: orange; }
.mfcl-chart .chart-area-symbol{-fx-background-radius: 0;}
- is blocked by
-
JDK-8101864 Add createSymbols Property to AreaChart / StackedAreaChart
-
- Resolved
-