-
Type:
Bug
-
Resolution: Fixed
-
Priority:
 P4
P4
-
Affects Version/s: 8
-
Component/s: javafx
-
Environment:
Windows 7, Ef(x)clipse 4.2.2, JDK 1.8 (build 117).
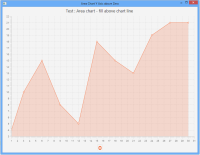
When creating an areaChart with y axis which start with value bigger than zero, it fills the area above the chart line instead of the area below the chart line.(E.g. the vertical area between the values and y max value instead of the vertical area between the values and y min value).
A test app which reproduces the problem:
import javafx.application.Application;
import javafx.scene.Scene;
import javafx.scene.chart.AreaChart;
import javafx.scene.chart.NumberAxis;
import javafx.scene.chart.XYChart;
import javafx.stage.Stage;
public class AreaChartSample extends Application {
@Override public void start(Stage stage) {
stage.setTitle("Area Chart Y Axis above Zero");
final NumberAxis xAxis = new NumberAxis(1, 31, 1);
final NumberAxis yAxis = new NumberAxis();
final AreaChart<Number,Number> ac =
new AreaChart<Number,Number>(xAxis,yAxis);
ac.setTitle("Test : Area chart - fill above chart line ");
yAxis.forceZeroInRangeProperty().set(false);
XYChart.Series<Number, Number> seriesTest= new XYChart.Series<Number,Number>();
seriesTest.getData().add(new XYChart.Data<Number,Number>(1, 4)); // change the 4 to 0 to 'fix' the problem
seriesTest.getData().add(new XYChart.Data<Number,Number>(3, 10));
seriesTest.getData().add(new XYChart.Data<Number,Number>(6, 15));
seriesTest.getData().add(new XYChart.Data<Number,Number>(9, 8));
seriesTest.getData().add(new XYChart.Data<Number,Number>(12, 5));
seriesTest.getData().add(new XYChart.Data<Number,Number>(15, 18));
seriesTest.getData().add(new XYChart.Data<Number,Number>(18, 15));
seriesTest.getData().add(new XYChart.Data<Number,Number>(21, 13));
seriesTest.getData().add(new XYChart.Data<Number,Number>(24, 19));
seriesTest.getData().add(new XYChart.Data<Number,Number>(27, 21));
seriesTest.getData().add(new XYChart.Data<Number,Number>(30, 21));
Scene scene = new Scene(ac,800,600);
ac.getData().add(seriesTest);
stage.setScene(scene);
stage.show();
}
public static void main(String[] args) {
launch(args);
}
}
- relates to
-
JDK-8097286 Area Chart with negative values
-

- Resolved
-

