Uploaded image for project: 'JDK'
  1. JDK
  2. JDK-8124029

XYCharts draw values incorrectly when zero is not within yAxis bounds

    XMLWordPrintable

Details

    Description

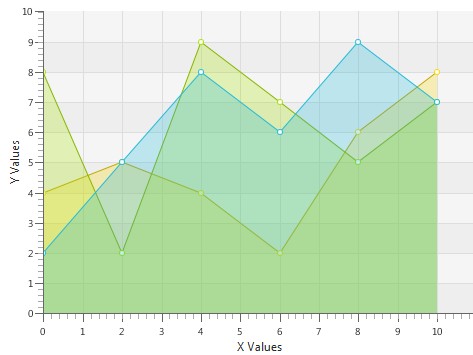
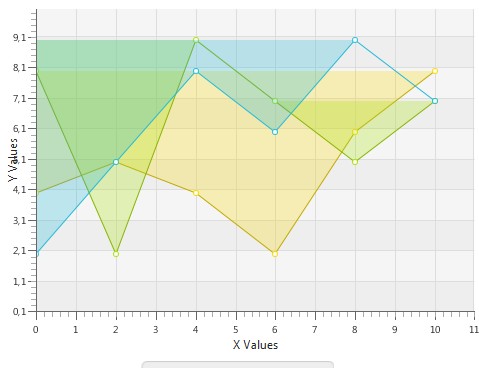
      Look at pictures. Both of them are produced with the same data but different yAxis bounds.

      This is appicable to AreaChart, StackedAreaChart and BarChart

      Attachments

        1. AreaChartApp.java
          4 kB
        2. bar-chart-1.jpg
          bar-chart-1.jpg
          25 kB
        3. bar-chart-2.jpg
          bar-chart-2.jpg
          19 kB
        4. screenshot-1.jpg
          screenshot-1.jpg
          27 kB
        5. screenshot-2.jpg
          screenshot-2.jpg
          30 kB
        6. stacked-area-chart-1.jpg
          stacked-area-chart-1.jpg
          33 kB
        7. stacked-area-chart-2.jpg
          stacked-area-chart-2.jpg
          30 kB

        Issue Links

          Activity

            People

              psomashe Parvathi Somashekar (Inactive)
              mrkam Alexander Kuznetcov (Inactive)
              Votes:
              0 Vote for this issue
              Watchers:
              1 Start watching this issue

              Dates

                Created:
                Updated:
                Resolved:
                Imported: