-
Type:
Bug
-
Resolution: Fixed
-
Priority:
 P3
P3
-
Affects Version/s: 7u6
-
Component/s: javafx
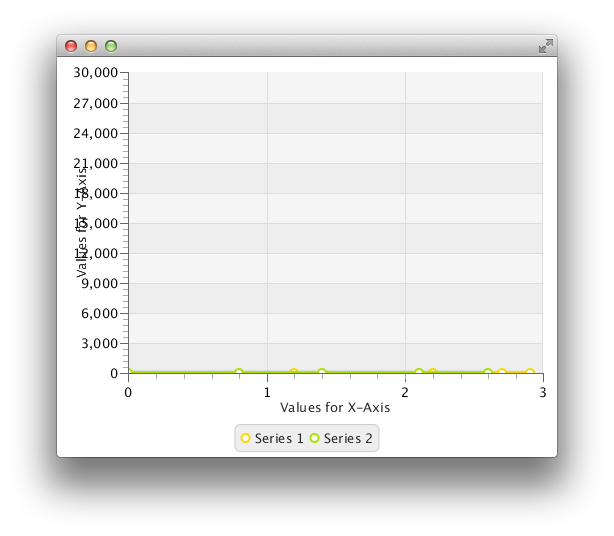
See attached picture, a simple chart where YAxis has ranges in the 10,000s the numbers are too big and are drawn over top of Axis Label. This is a regression and used to work. Below is the very simple test case. I think the issue is prefWidth() for the Axis is returning wrong value. This may be do to the fact that text node used for measuring doesn't have same font and size as text nodes for axis tick marks.
public class LineChartApp extends Application {
@Override public void start(Stage primaryStage) throws Exception {
NumberAxis xAxis = new NumberAxis("Values for X-Axis", 0, 3, 1);
NumberAxis yAxis = new NumberAxis("Values for Y-Axis", 0, 30000, 3000);
ObservableList<XYChart.Series<Double,Double>> lineChartData = FXCollections.observableArrayList(
new LineChart.Series<Double,Double>("Series 1", FXCollections.observableArrayList(
new XYChart.Data<Double,Double>(2.9, 0.5)
)),
new LineChart.Series<Double,Double>("Series 2", FXCollections.observableArrayList(
new XYChart.Data<Double,Double>(2.6, 0.9)
))
);
LineChart chart = new LineChart(xAxis, yAxis, lineChartData);
Scene scene = new Scene(chart);
primaryStage.setScene(scene);
primaryStage.show();
}
public static void main(String[] args) {
launch(args);
}
}
- is blocked by
-
-

- Resolved
-
- relates to
-
-
- Closed
-