Win. 7, JDK9 b129
Please run the attached test case having
NumberAxis x = new NumberAxis("x", -2., 2., 0.5);
NumberAxis y = new NumberAxis("y", -2., 2., 0.5);
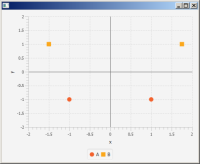
The chart looks as "plot_1.png" - ok.
Then please swap the lower and the upper bounds for the axes:
NumberAxis x = new NumberAxis("x", 2., -2., 0.5);
NumberAxis y = new NumberAxis("y", 2., -2., 0.5);
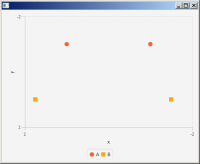
1) the chart is plotted (hopefully this is an expected result)
2) the chart looks as "plot_2.png" - nok: no zero axes and ticks (please try also to set tick unit = -0.5 - still no ticks)
Probably the docs should be updated as well (see NumberAxis constructor):
"minValue - The min data value that needs to be plotted on this axis
maxValue - The max data value that needs to be plotted on this axis"
Here -2 is "max" value and 2 is "min", - but this is a question of terminology ("lower/upper bound" instead of "min/max"?)...

