from openjdk-gc-user:
"Hello,
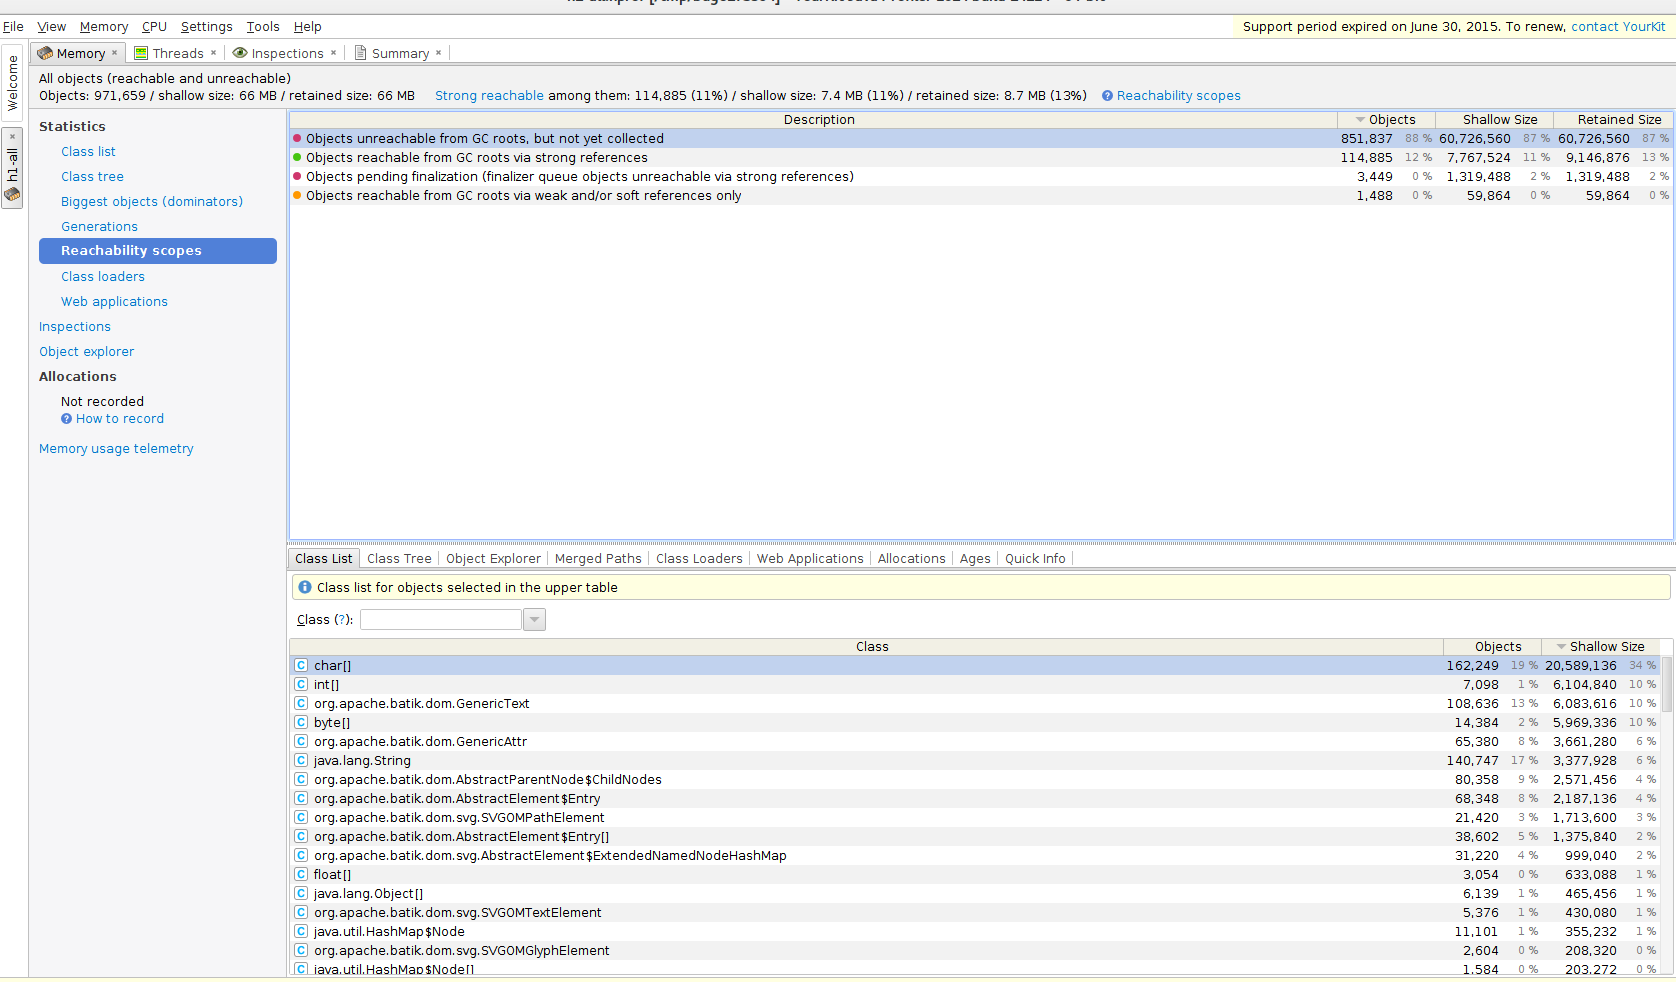
I am working on a closed source software that uses a patched version of apache-batik to display SVG-Documents one by one. If you keep loading and discarding some specific SVG-Documents memory consumption keeps on growing until it reaches more than 95% of the available memory. The application becomes unusable slow, very little memory gets freed, although the gc is constantly running. Sometimes an OutOfMemoryError gets thrown. I took memory snaphsots and analyzed them using jvisualvm and yourkit. These tools report the majority of the memory as unreachable.
I have tried different garbage collectors (G1,ConcurrentMarkSweep),
and different Versions of Java: 1.8_60;1.8_65;1.8_102, the issue is always reproducible.
Is there something i can do to debug this further? I am currently not able to reproduce this issue in a somewhat small self contained example.
I could provide gc-logs and the heap dump (about 1gb zipped) or any other debuging info if someone is interested."
I am able to reproduce this with a micro. It might be related how gc reports object liveness when traversing the heap.
May assign to gc if needed.
"Hello,
I am working on a closed source software that uses a patched version of apache-batik to display SVG-Documents one by one. If you keep loading and discarding some specific SVG-Documents memory consumption keeps on growing until it reaches more than 95% of the available memory. The application becomes unusable slow, very little memory gets freed, although the gc is constantly running. Sometimes an OutOfMemoryError gets thrown. I took memory snaphsots and analyzed them using jvisualvm and yourkit. These tools report the majority of the memory as unreachable.
I have tried different garbage collectors (G1,ConcurrentMarkSweep),
and different Versions of Java: 1.8_60;1.8_65;1.8_102, the issue is always reproducible.
Is there something i can do to debug this further? I am currently not able to reproduce this issue in a somewhat small self contained example.
I could provide gc-logs and the heap dump (about 1gb zipped) or any other debuging info if someone is interested."
I am able to reproduce this with a micro. It might be related how gc reports object liveness when traversing the heap.
May assign to gc if needed.
- duplicates
-
JDK-8081323 ConstantPool::_resolved_references is missing in heap dump
-

- Resolved
-
- relates to
-
-
- Resolved
-