-
Type:
Enhancement
-
Resolution: Unresolved
-
Priority:
 P4
P4
-
Affects Version/s: 18
-
Component/s: hotspot
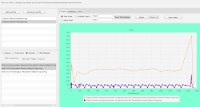
Some measurements with specjbb2015 fixed ir=6000, 16gb heap and inducing evacuation failures using G1EvacuationFailureALot (everything else related normal) shows that evacuation failures lengthen the "Object Copy" phase a lot.
See the attached graph that shows "Object Copy" time for evacuation failures and without within that run.
With object pinning we need this to be almost as fast, so investigate what could be done here.
Some ideas:
* move out absolutely unnecessary code from object copy, ie. statistics gathering for JFR; could be done when removing the self-forwards, or in an extra stage later (i.e. recording all object sizes and do the statistics separately in parallel)
* potentially always record preserved marks for failed objects; checking whether it is actually required may be more costly than just doing that all the time (would somewhat work together withJDK-8254739)
* maybe other suggested changes (splitting processing "large" objects,JDK-8271870) helps because this is a work distribution problem in the end
* avoid the constant lookup of various data via the HeapRegion* pointer; we have the G1HeapRegionAttr available
* usual micro-optimizations like look for code duplication along the call chain
Of course, first analyze what is responsible for the slowdown.
See the attached graph that shows "Object Copy" time for evacuation failures and without within that run.
With object pinning we need this to be almost as fast, so investigate what could be done here.
Some ideas:
* move out absolutely unnecessary code from object copy, ie. statistics gathering for JFR; could be done when removing the self-forwards, or in an extra stage later (i.e. recording all object sizes and do the statistics separately in parallel)
* potentially always record preserved marks for failed objects; checking whether it is actually required may be more costly than just doing that all the time (would somewhat work together with
* maybe other suggested changes (splitting processing "large" objects,
* avoid the constant lookup of various data via the HeapRegion* pointer; we have the G1HeapRegionAttr available
* usual micro-optimizations like look for code duplication along the call chain
Of course, first analyze what is responsible for the slowdown.
- relates to
-
JDK-8254739 G1: Optimize evacuation failure for regions with few failed objects
-

- Resolved
-
-
JDK-8271870 G1: Add objArray splitting when scanning object with evacuation failure
-

- Resolved
-
-
JDK-8274191 Improve g1 evacuation failure injector performance
-

- Resolved
-
-
JDK-8276094 JEP 423: Region Pinning for G1
-

- Closed
-
