Flight Recorder has a method sampler that works well for finding the Java methods that executes the most, but sometimes it can be interesting to know if a method has been invoked at all, and if so, for how long, and from where. Sampling is too coarse and the invocation is likely to be missed if it only happens once or twice.
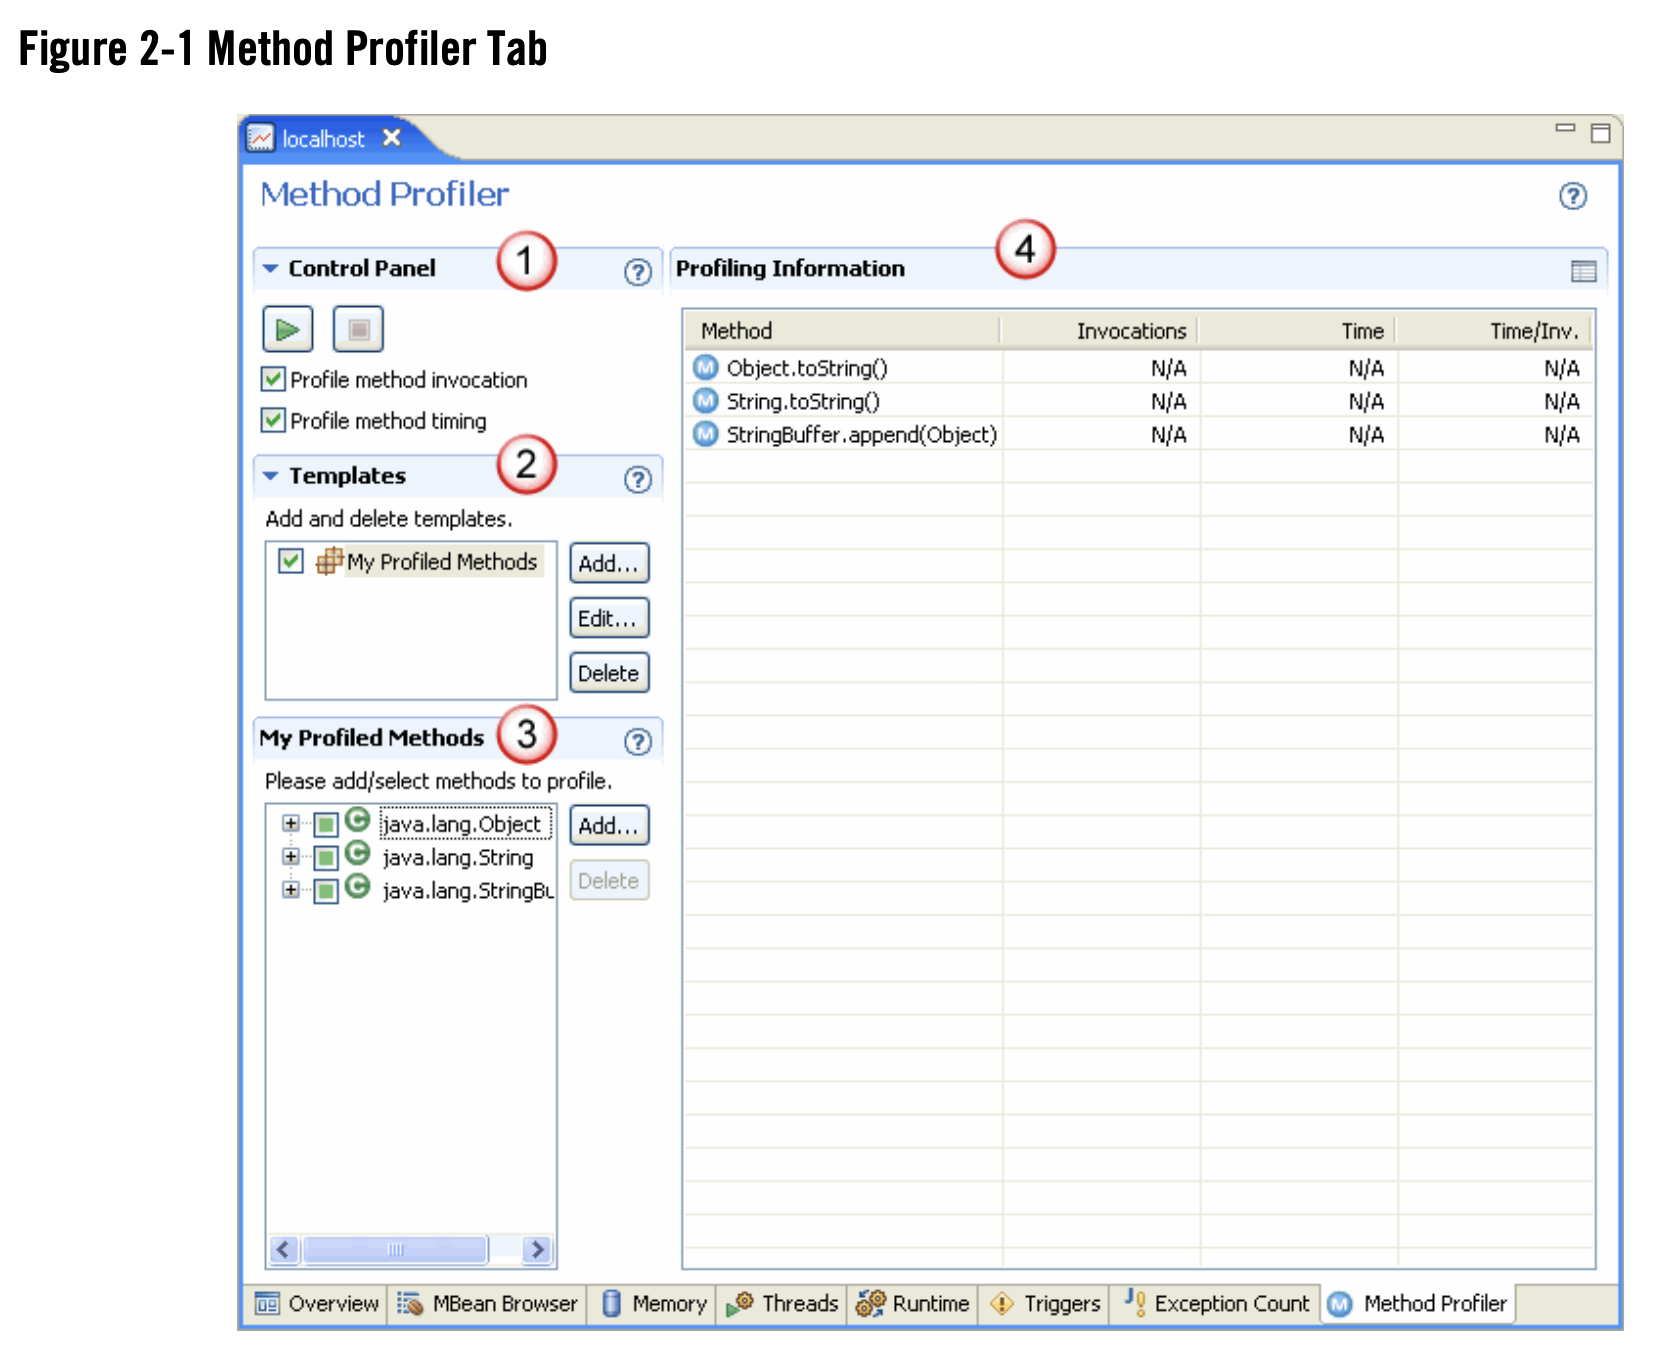
The JRockit JVM had an MBean that could count method invocations and the time it took for a to method execute. See attached screenshot from an earlier release of JMC.
With Flight Recorder supporting event streaming and a 'view' command, similar functionality can be implemented without the need for a dedicated MBean, or changes to JMC GUI. Some use cases are:
- Microbenchmarking methods that are not easily isolated into a JMH benchmark.
- See the stack trace from where class initialization is triggered, useful for reducing startup time
- Debugging an application in production. Is this method executed, and if so, how many times? Can be useful for finding resource leaks.
Example usage:
$ java -XX:StartFlightRecording:method-time=payroll.EmployeeController:: newEmployee(Employee) ...
$ jcmd <pid> method-time
$ java -XX:StartFlightRecording:method-count=java.io.FileOutputStream.FileOutputStream(File, boolean)
$ jcmd <pid> method-count
$ java -XX:StartFlightRecording:method-trace=com.example.Singleton::<clinit>,filename=recording.jfr
$ jfr view method-trace recording.jfr
The filter expression (may not look like above) that is passed to -XX:StartFlightRecording could contain multiple methods/classes, or wildcards, so all methods in a package could be instrumented. It may not be a good idea for performance reasons, though. If the class is an interface, for example, java.sql.Connection, all the implementations of that interface could be instrumented.
The Method Time and Method Count events are emitted at the end of a chunk, by default, but could be flushed if 'jcmd view' is executed, or at every other second if a GUI is connected that displays a live view.
The Method Trace event is emitted when the invocation happens.
- duplicates
-
JDK-8352738 Implement JEP 520: JFR Method Timing and Tracing
-

- Resolved
-