We can extract heap dump from coredump with `jhsdb jmap --binaryheap`, but it does not contain `HPROF_GC_ROOT_JAVA_FRAME`. It means we cannot detect leaked object on thread stack.
I attached 2 images which I saw on Eclipse Memory Analyzer Tool (MAT). Heap dumps were created following options:
-Xmx256m -XX:+CrashOnOutOfMemoryError -XX:+HeapDumpOnOutOfMemoryError
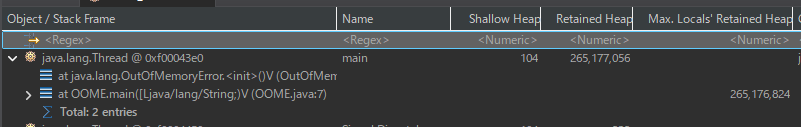
heapdumponoutofmemoryerror.png shows "thread overview" from the heapdump by `-XX:+HeapDumpOnOutOfMemoryError`. It reports `OOME.main` has large retained heap.
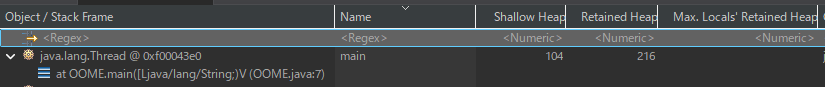
On the other hand, from-core.png extracted by `jhsdb jmap --binaryheap` does not report it - leaked object is reported as unreachable objects.
heapDump.cpp in HotSpot dumps `HPROF_GC_ROOT_JAVA_FRAME` for each Java frames. SA should do that.
I attached 2 images which I saw on Eclipse Memory Analyzer Tool (MAT). Heap dumps were created following options:
-Xmx256m -XX:+CrashOnOutOfMemoryError -XX:+HeapDumpOnOutOfMemoryError
heapdumponoutofmemoryerror.png shows "thread overview" from the heapdump by `-XX:+HeapDumpOnOutOfMemoryError`. It reports `OOME.main` has large retained heap.
On the other hand, from-core.png extracted by `jhsdb jmap --binaryheap` does not report it - leaked object is reported as unreachable objects.
heapDump.cpp in HotSpot dumps `HPROF_GC_ROOT_JAVA_FRAME` for each Java frames. SA should do that.
- relates to
-
JDK-8306591 SA and hotspot generate different hprof records for GC roots
-

- Open
-
- links to
-
 Commit(master)
openjdk/jdk/24f67917
Commit(master)
openjdk/jdk/24f67917
-
 Review(master)
openjdk/jdk/29058
Review(master)
openjdk/jdk/29058