-
Type:
Enhancement
-
Resolution: Unresolved
-
Priority:
 P2
P2
-
None
-
Affects Version/s: 6.0.0
-
Component/s: Mission Control Client
-
generic
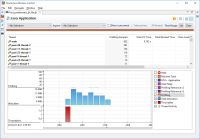
The scale of the y-axis of charts with buckets have problems. Sometimes the scale on the y-axis adjust only down to a fixed level. To see this in action, open a recording an go to the Java Application page. In the Profiling chart, zoom in on any of the buckets you see. Keep zooming until you see the individual events. The scale on the y-axis goes from around 200 to 100, but never less than that. The problem with this is that the events become wafer thin: one pixel or so. You can hardly click them.
As far as I know, the background is that we don't want the profiling chart to seem busy when it isn't. I don't know about my recording (will be attached), but it should be fairly busy – I was creating reports from a bunch of jfr files. If it wasn't busy I should be concerned.
The opposite problem occurs if you zoom in a little on some bucket in e.g. the File I/O page. You look at the size of the bucket ("almost reaches the top of the graph") and scroll left or right to find other file read events. You will soon find out that all of them "almost reaches the top of the graph" – because the scale has changed.
I don't have a simple solution for this, but I think we should consider spending some time thinking about it.
