-
Type:
Bug
-
Resolution: Fixed
-
Priority:
 P4
P4
-
Affects Version/s: 9.1.0
-
Component/s: Mission Control Client
-
None
-
Environment:
JDK Mission Control 9.1.0+b07
(Qualifier: 202502050944, Change id: d147ea1ea5f2e98d0c336263e3c1592d4bb973a9)
-
aarch64
-
os_x_10.15
-
JMC 10 Sprint 1
When viewing a JFR recording in the Memory view, selecting a specific type of object often fails to show the specific traces for that type. Instead, it immediately reverts to the aggregate view of all traces.
Given a trace acquired from JRuby, here's the initial view of the Memory tab, showing the aggregate list of allocation traces.
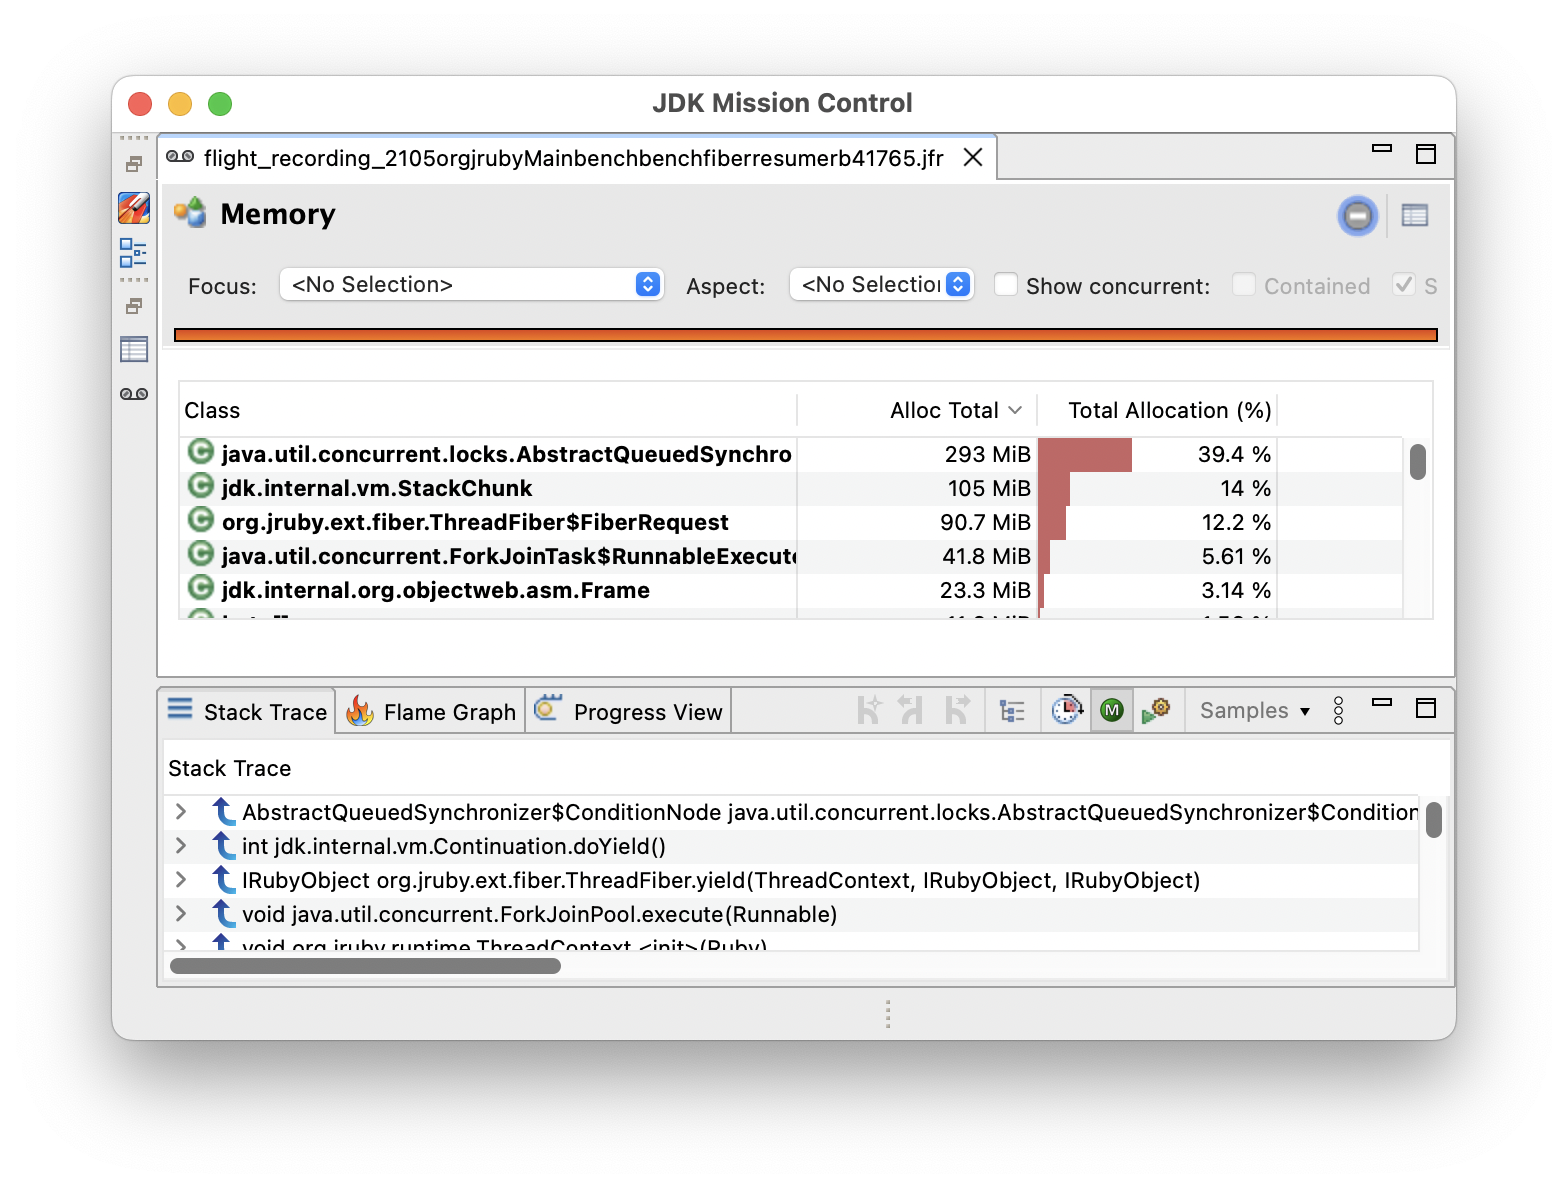
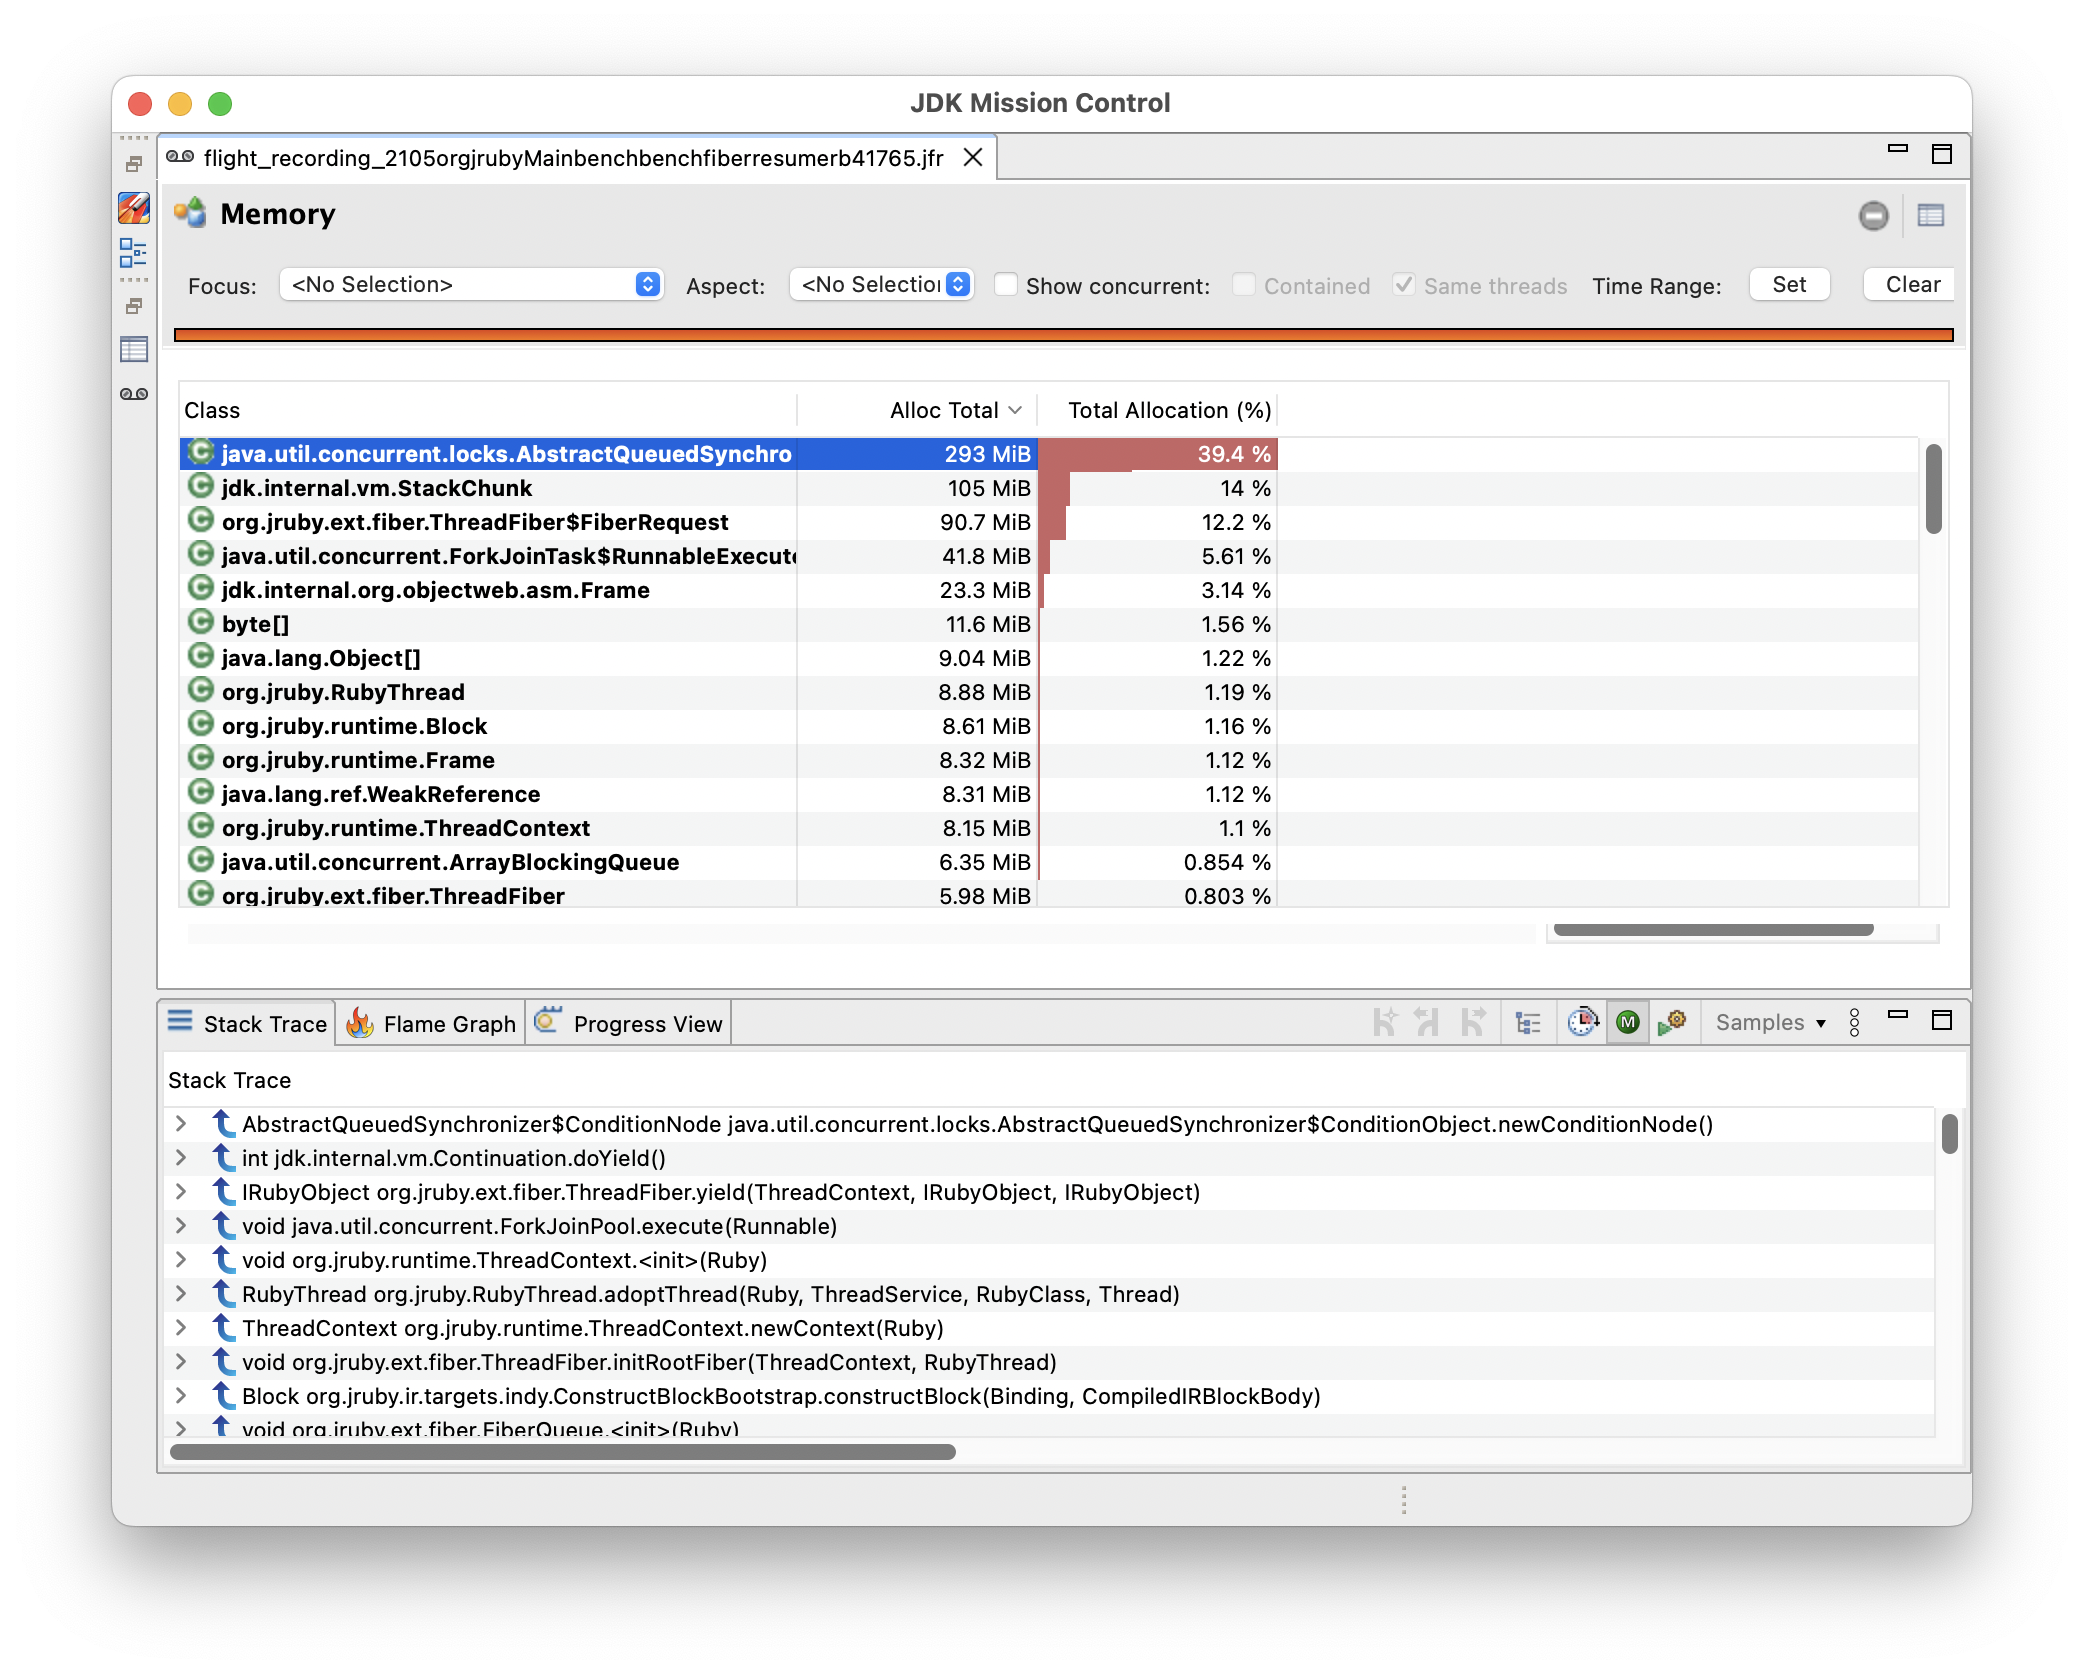
Selecting the first object type in the list should show only the traces relevant to that type, but instead it immediately reverts to the same aggregate list.

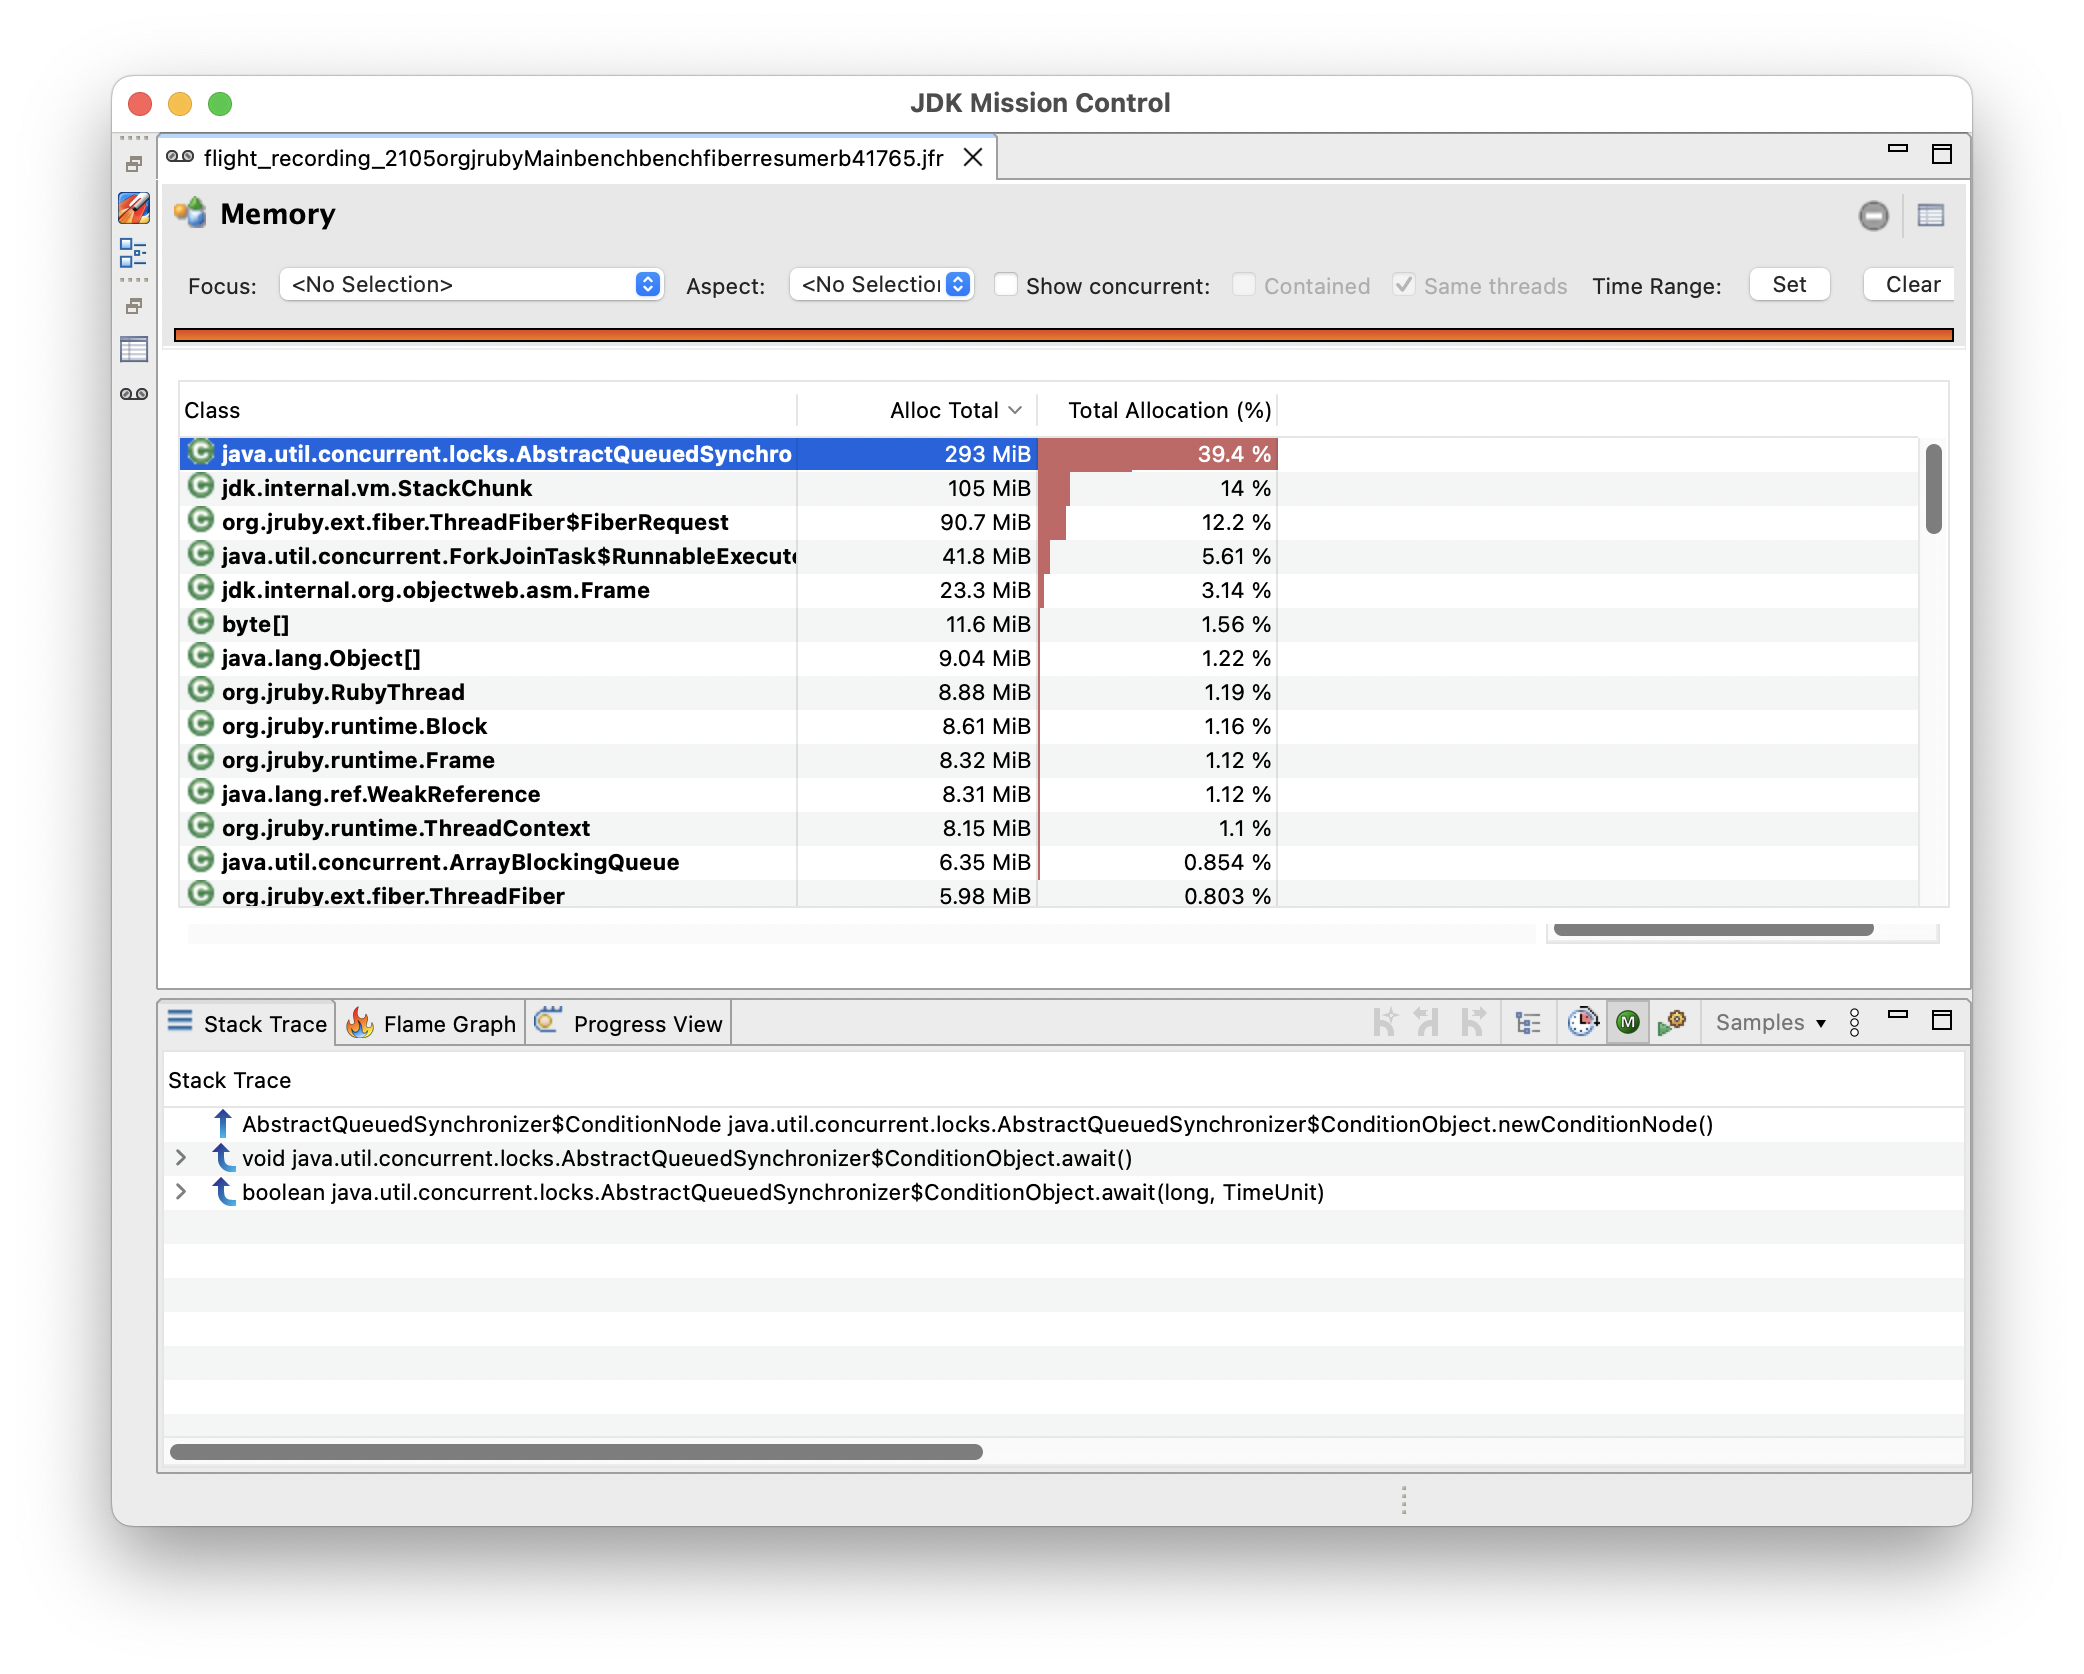
After repeatedly selecting different objects, sometimes you can get it to stay on the list of traces specific to that object. You can also force this to happen by selecting the "Group traces from thread root" button and then going back to "Group traces from last method frame". The expected view is provided below.

It happens consistently on my M1 MacBook Air, and only one out of perhaps ten tries does it stay on the specific trace list. It does not appear to happen on a second MacOS machine I have that's slightly more powerful, an M1 Mac Mini. Both are running fairly recent versions of MacOS 15, but I have been seeing this behavior for at least the last year.
I can provide a JFR recording if necessary, but it happens consistently with every recording I take on that machine and there's nothing particularly interesting about any of them.

- links to
-
 Commit(master)
openjdk/jmc/db49d805
Commit(master)
openjdk/jmc/db49d805
-
 Review(master)
openjdk/jmc/647
Review(master)
openjdk/jmc/647